AI observability gives you end-to-end visibility into model inputs, model outputs, retrieval context, tool calls, and the infrastructure underneath so you can judge correctness, grounding, safety, and cost, not just whether the server is up. Traditional monitoring tells you your
API returned a 200. AI observability tells you whether the answer inside that 200 was true, safe, and worth what it cost to generate.
If you’re standing up observability for an LLM or agent system right now, monitor these four things first:
- Prompt I/O. Capture the prompt template, the actual rendered prompt, retrieved documents, and the model’s response, together, not as separate fragments you have to reassemble later.
- Token and cost metrics. Track input tokens, output tokens, and dollar cost per request, per user, and per feature, so a runaway agent loop shows up before finance notices.
- Trace-level spans. Instrument the full chain: retrieval, model call, tool calls, and any downstream actions, as a single connected trace rather than isolated logs.
- Infrastructure metrics that affect model behavior. GPU memory, queue depth, and latency percentiles matter because a starved GPU produces truncated or degraded outputs, not just slow ones.
Copy this into your next sprint ticket: “Before shipping, confirm we can see the prompt, the retrieved context, the token spend, and the trace, for a single request, in one place.” If you can’t answer that today, you don’t have AI observability yet. You have logs.
Key Takeaways
AI observability works when teams capture prompt, retrieval, token, and trace data end to end, on OpenTelemetry standards, and feed failures back into evaluators that gate every release.
| Point | Details |
|---|---|
| Instrument prompt and response traces | Capture the rendered prompt, retrieved context, and response together on a single connected trace. |
| Start token and cost tracking now | Track tokens and dollar cost per call, per user, and per agent to catch runaway spend early. |
| Build a small online evaluator | Score a sample of production traffic automatically so drift and regressions surface before customers notice. |
| Standardize on OpenTelemetry | Use OTLP and GenAI semantic conventions to keep traces portable and avoid vendor lock-in. |
| Close the loop with CI/CD | Gate releases on evaluator scores against a golden dataset built from real failed traces. |
| Bring in outside expertise when gaps are structural | Bowtie audits existing AI applications and builds the OTLP pipelines, SLOs, and evaluation dashboards teams need to trust production. |
Table of Contents
- Why AI Observability Matters (and How It Differs From Traditional Observability)
- What Are the Core Layers of AI Observability?
- What Signals Should You Capture for LLMs and Agents?
- How Do You Instrument AI Systems With OpenTelemetry?
- Which Observability Tools Fit Your Stage: Dev, Production, or Evaluation?
- How Do You Roll Out AI Observability Without Breaking Production?
- What SLOs and Alerts Actually Work for AI Systems?
- What Are the Biggest Pitfalls in AI Observability, and How Do You Avoid Them?
- How Do You Evaluate AI System Quality Over Time?
- What Does AI Observability Look Like in Real Client Work?
- How Bowtie Helps You Build Production-Grade AI Observability
- Frequently Asked Questions
- Sources
Why AI Observability Matters (and How It Differs From Traditional Observability)
Traditional software either works or it doesn’t. A null pointer exception is unambiguous. A large language model, by contrast, can return a fluent, well-formatted, completely wrong answer with a 200 status code and normal latency, and your existing dashboards will show a healthy system the entire time.
That’s the core problem. Deterministic software has one right answer for a given input. Generative models don’t. The same prompt can return different phrasing, different reasoning paths, and occasionally a different conclusion, on two consecutive calls. Datadog frames AI observability as tracking whether outputs are correct, grounded, safe, and useful, not merely whether the system is running, and that distinction is the whole ballgame. Uptime and latency remain necessary. They stop being sufficient the moment your product’s failure mode moves from “crashed” to “confidently wrong.”
The real risks compound quickly once you’re running anything beyond a toy demo:
- Hallucinations that read as authoritative but cite sources that don’t exist or misstate facts from ones that do.
- Retrieval failures where your vector database returns stale or irrelevant chunks and the model dutifully answers from bad context.
- Prompt drift, where a template edited by one team quietly breaks a workflow another team depends on.
- Token cost spikes, often from an agent stuck in a retry loop or a context window that’s grown unbounded.
- Silent correctness regressions, where a model provider updates a backend version and your outputs shift in quality with zero code change on your end.
Without full pipeline visibility, teams end up debugging by guesswork, tweaking prompts and hoping. Kong’s guide to AI observability makes the point plainly: capturing only model-level telemetry, tokens and latency, without the retrieved documents and prompt template, leaves root-cause analysis for hallucinations nearly impossible.
Three scenarios show this in practice. A retrieval-augmented generation (RAG) system starts hallucinating product specs, and the fix turns out to be a broken document chunking job, invisible without retrieval traces. A customer support agent’s token spend triples overnight because a tool call started returning malformed JSON, triggering silent retries. A latency regression in the embedding step adds 400 milliseconds to every request, degrading the user experience long before anyone files a complaint. Each of these is diagnosable, but only if you were already capturing the right signal.
What Are the Core Layers of AI Observability?
Effective observability maps cleanly onto the layers of a real AI system, and each layer has different owners, different telemetry, and different retention needs.
- Application layer. UI events, user feedback (thumbs up/down, edits, abandonment), and session context. Product teams typically own this.
- Orchestration and agent layer. Tool calls, agent decisions, branching logic, and multi-step task chains. This is where agentic systems live or die, and it’s the layer most teams under-instrument.
- Retrieval and data layer. Vector database queries, retrieved documents, embedding versions, and chunking strategy. Data engineering usually owns this, but it needs to be visible to whoever debugs model behavior.
- Model/LLM call layer. The actual API call: model name, version, parameters, prompt, and response. Platform or ML engineering territory.
- Infrastructure layer. GPU/CPU utilization, network latency, queue depth, autoscaling events. Classic SRE territory, but now correlated with model quality signals instead of siloed from them.
Each layer produces different telemetry types. Application and orchestration layers generate events and traces. Retrieval and model layers need traces plus periodic dataset snapshots (so you can replay what the model actually saw). Infrastructure produces metrics and logs, the traditional stuff your existing stack already handles.
Retention deserves its own line item here. Full-fidelity prompt and response data for every request gets expensive fast, both in storage cost and in privacy exposure. Most teams settle on full retention for a sampled subset (flagged errors, low-scoring evaluations, high-value users) and aggregate-only retention for the rest. Assign an owner per layer before you instrument anything. Without it, orchestration and retrieval telemetry, the two layers most teams miss, end up belonging to nobody.
What Signals Should You Capture for LLMs and Agents?
Operational signals are the easy part; most teams already collect latency, error rates, throughput, retries, and infrastructure metrics like GPU memory and dependency health from existing monitoring stacks such as Prometheus. The signals that actually differentiate AI observability from classic monitoring are LLM-specific and agent-specific.
LLM-specific signals you need on every span:
- Prompt text or template identifier, plus the rendered version actually sent
- Retrieved documents or context passed into the prompt
- Model name and version (providers update these more often than you’d expect)
- Parameters: temperature, top_p, max tokens
- Token counts for both request and response, split out separately
- Cost attribution, calculated per call and rolled up per user or feature
- Response quality scores, whether automated, human-reviewed, or both
- Guardrail violations, flagged content, or policy trigger events
Agent-specific signals, which most teams add too late:
- Multi-step traces spanning every tool call within a single agent task, not just the final output
- Decision logs showing why the agent chose one tool or path over another
- Per-agent and per-task cost and token spend, since a single user request can fan out into a dozen model calls
- Behavioral drift metrics, tracking whether an agent’s tool-selection patterns shift over time as the underlying model updates
MeshAI Labs’ writeup on agent observability recommends exactly this: extending LLM observability with per-hop latency, tool-call failure tracking, and policy events, all correlated through a single trace ID. That correlation is what turns a pile of logs into an actual debugging tool.
Pro Tip: A single agentic customer support task can generate many model calls once you count retries, tool invocations, and sub-agent delegation. If your cost dashboard only shows spend per top-level request, you’re blind to the multiplier hiding inside each one.
How Do You Instrument AI Systems With OpenTelemetry?
OpenTelemetry has become the closest thing to a shared standard for AI observability, and for good reason: it’s vendor-neutral. Traces and attributes captured through OpenTelemetry’s GenAI semantic conventions stay portable across backends, so switching from one observability platform to another doesn’t mean re-instrumenting your entire codebase. That portability matters more in AI tooling than almost anywhere else in the stack, because this vendor category is still consolidating and shifting fast.
Auto-instrumentation libraries like OpenLLMetry (built by Traceloop) and OpenLIT wrap common LLM SDKs, OpenAI’s client, Anthropic’s client, LangChain, and others, so calls automatically emit OTLP spans without you hand-writing instrumentation for every provider. This is usually the fastest path to a working pipeline: install the SDK wrapper, point it at a collector, and you have traces within an afternoon rather than a sprint.
A minimal OTLP collector pipeline looks roughly like this in practice:
receivers:
  otlp:
    protocols:
      grpc:
      http:
processors:
  batch:
  attributes/redact:
    actions:
      - key: llm.prompt
        action: hash
exporters:
  prometheus:
  otlp/jaeger:
service:
  pipelines:
    traces:
      receivers: [otlp]
      processors: [batch, attributes/redact]
      exporters: [otlp/jaeger]
    metrics:
      receivers: [otlp]
      exporters: [prometheus]
On each span, tag llm.model.name, llm.model.version, llm.token.count.prompt, llm.token.count.completion, llm.cost.usd, and a trace.id that ties the model call back to its parent request. Feed traces into Jaeger for visualization, metrics into Prometheus for alerting, and both into Grafana for a unified dashboard. That three-tool combination, Prometheus for metrics, Jaeger for traces, Grafana for visualization, is the de facto open-source reference stack the OpenTelemetry community itself demonstrates.
Pro Tip: Decide what to redact before you instrument, not after a security review flags it. You get full visibility where it matters and control your storage bill everywhere else.
Which Observability Tools Fit Your Stage: Dev, Production, or Evaluation?
Not every observability platform solves the same problem, and picking one before you know which stage you’re optimizing for is how teams end up paying for enterprise features they never touch. Evaluate any candidate against six dimensions:
- Best for: development and evaluation experimentation, or production-scale monitoring, or both.
- Scope of signals: does it capture traces, metrics, and logs, or does it stop at basic metrics and skip LLM-specific evaluation entirely?
- Deployment model: self-hosted open-source you control, or managed SaaS you don’t.
- OpenTelemetry compliance: does it speak OTLP natively, or does it lock you into a proprietary SDK?
- Scale and cost: how does pricing behave at 10 million traces a month versus 10,000?
- Ease of instrumentation: auto-instrumentation SDKs available, or manual wiring required for every call site?
| Category | Best for | Scope of signals | Deployment model | OTel compliance | Ease of instrumentation |
|---|---|---|---|---|---|
| Open-source local-first stacks | Dev and evaluation | Traces, metrics, logs, custom eval scoring | Self-hosted | Native, built on OTLP | SDK auto-instrumentation, moderate setup |
| SaaS-managed platforms | Production at scale | Traces, metrics, logs, managed eval dashboards | Fully managed | Usually OTel-compatible ingestion | Low, mostly config-driven |
| Probe/proxy patterns | Cost and cache monitoring | API-level metrics, cost, caching | Self-hosted proxy layer | Partial, depends on implementation | Low, sits in front of API calls |
| Agent control-plane tools | Multi-agent production systems | Multi-step traces, per-agent cost, drift | Mixed, self-hosted or managed | Growing OTel adoption | Moderate, agent-framework specific |
Open-source, local-first stacks, projects like Opik from Comet, give you tracing and evaluation tooling in one package, which suits teams that want full data control and don’t want prompt content leaving their infrastructure. That’s the right call for regulated industries or anyone still validating product-market fit before committing to a managed contract.
Managed SaaS platforms earn their cost at production scale, when you need on-call alerting, managed dashboards, and someone else operating the ingestion pipeline at millions of traces per day. Proxy-based patterns, sitting between your app and providers like OpenAI or Anthropic, work well specifically for cost tracking and caching without touching your application code. LangChain’s rundown of observability tools covers this proxy pattern alongside notebook-first approaches that suit teams still in the experimentation phase. Agent control-plane tools matter most once you’re running true multi-agent systems where correlating five or six agents’ worth of traces by hand stops being realistic. Cloud-native options from OpenAI, Anthropic, Google Vertex AI, AWS Bedrock, and Azure AI Foundry increasingly bake in native tracing and evaluation hooks too, which is worth checking before you bolt on a third-party layer for signals your provider already exposes.
How Do You Roll Out AI Observability Without Breaking Production?
You don’t need a six-month initiative to get real visibility. Here’s a six-step sequence that works with an existing stack rather than against it.
- Instrument request and response capture, including retrieval. Wrap your model calls and retrieval steps so every request logs the rendered prompt, retrieved documents, and response together. Acceptance criteria: you can pull up a single record showing exactly what the model saw and said for any given request.
- Emit OTLP spans and metrics. Add OpenTelemetry instrumentation (or an auto-instrumentation SDK like OpenLLMetry) so traces and metrics flow to a collector automatically. Acceptance criteria: a trace for a full RAG request shows retrieval, model call, and any tool calls as connected spans.
- Collect and store traces with redaction rules already applied. Route the collector output to your chosen backend, Jaeger, Grafana, or a managed platform, with PII redaction and sampling rules configured up front. Acceptance criteria: sensitive prompt content is hashed or truncated before it hits long-term storage.
- Build evaluators and golden datasets from real failed traces. Pull actual production failures into a curated dataset rather than inventing synthetic test cases. Acceptance criteria: you have at least 50 to 100 labeled examples covering your top three failure modes.
- Define SLOs and alerting thresholds. Set concrete, measurable targets (covered in detail below) rather than vague “keep quality high” goals. Acceptance criteria: each SLO has an owner and a paging policy attached.
- Integrate into CI/CD and pre-deploy tests. Gate releases on evaluator scores against your golden dataset, the same way you’d gate on unit tests. Acceptance criteria: a prompt or model change that regresses quality fails the build before it reaches production.
Pro Tip: Before you scale ingestion to full production volume, pull ten traces at random and try to answer “why did this fail?” using only what you’ve captured. If you can’t reconstruct the failure from the trace alone, you’re missing a field, usually the retrieved context or the exact prompt template version, and it’s cheaper to fix that now than after you’ve built dashboards on top of incomplete data.
What SLOs and Alerts Actually Work for AI Systems?
Generic uptime SLOs don’t catch the failure modes that matter most for AI systems. You need targets built around correctness and cost, not just availability.
Concrete SLO examples worth adopting:
- Groundedness threshold: at least 95% of responses over a rolling 24 hour window must be scored as grounded in retrieved context by your evaluator.
- Hallucination rate: fewer than 20 flagged hallucinations per 10,000 requests, reviewed weekly against your golden dataset.
- Token spend per user task: a ceiling on average tokens consumed per completed task, flagged when a feature’s per-task cost drifts upward without a corresponding quality improvement.
- Per-agent cost per task: in multi-agent systems, a budget ceiling per agent role, since one misbehaving sub-agent can quietly dominate total spend.
Alerting works best in tiers rather than a single blanket threshold. Sample-and-score alerts, triggered when your automated evaluator’s failure rate crosses a threshold on a sampled window of production traffic, catch quality regressions early without paging someone on every single low-confidence response. Layer alerts from informational (a Slack notification that groundedness dipped slightly) up to paging (hallucination rate breached its SLO for two consecutive hours). Every alert needs a runbook attached, telling the on-call engineer exactly which trace fields to check first: retrieved context, prompt template version, or model version change.
Tie these SLOs to business KPIs explicitly. A support bot’s hallucination rate connects directly to ticket escalation rate and customer satisfaction scores; a sales-assist agent’s token cost per task connects directly to gross margin on that feature. Dynatrace’s guidance on AI observability recommends exactly this cross-correlation of model quality signals with infrastructure and business metrics, so triage can quickly determine whether an incident is model-related, retrieval-related, or purely an infrastructure problem. Route model-quality pages to ML engineering, infrastructure pages to platform/SRE, and keep both teams looking at the same trace data instead of two disconnected dashboards.
What Are the Biggest Pitfalls in AI Observability, and How Do You Avoid Them?
Most AI observability projects don’t fail because teams picked the wrong tool. They fail because of a handful of predictable, avoidable mistakes.
- Tracking only tokens and latency. These are the easiest signals to grab, which is exactly why teams stop there and miss correctness entirely.
- Omitting retrieval context. As covered earlier, without the exact documents retrieved and the rendered prompt, root-cause analysis for hallucinations becomes speculation.
- Under-sampling traces. Sampling at a flat 1% rate misses the rare, high-severity failures you actually need to see, since errors and edge cases aren’t evenly distributed across traffic.
- Vendor-side model changes breaking things silently. A provider updates a model version behind the scenes, and your outputs shift in quality with zero code change on your side to point to.
- Privacy exposure from raw prompt logging. Storing full, unredacted prompts and responses at scale turns your observability pipeline into a liability if it contains customer PII.
Mitigations map directly to each pitfall. Capture end-to-end traces from day one rather than bolting on retrieval visibility after an incident forces the issue. Use targeted sampling, weighted toward errors and low evaluator scores, as Dynatrace’s guidance suggests, storing full-fidelity data only for traces that cross a quality or error threshold. Build automated regression datasets from real failures so a prompt change gets tested against actual past incidents, not hypothetical ones. Monitor provider API changelogs and run scheduled evaluation batches against a fixed model version alongside production, so a silent vendor update shows up as a score delta instead of a mystery. And apply redaction policies at the collector level, hashing or truncating sensitive fields before storage, a practice worth reviewing against frameworks like GDPR compliance guidance for AI systems if you operate in regulated markets.
Pro Tip: When trace volume costs become genuinely prohibitive, keep full-fidelity data only for traces that fail an evaluator check, get flagged by a user, or come from high-value accounts. Everything else can drop to aggregate metrics. You lose granularity on routine successes you didn’t need anyway, and keep it exactly where debugging actually happens.
How Do You Evaluate AI System Quality Over Time?
Closing the loop between production and development is what separates teams that fix problems once from teams that keep rediscovering the same bug every quarter. That loop runs through two distinct types of evaluation.
Offline evaluation runs against curated datasets and controlled experiments, before code ships. You’re testing a specific prompt change or model swap against a fixed, known set of inputs where you already know the expected quality bar. Online evaluation scores real production traffic as it happens, catching drift, edge cases, and failure patterns that never showed up in your offline dataset because nobody thought to write that test case. You need both. Offline evaluation catches regressions before they ship; online evaluation catches the regressions offline testing didn’t anticipate.
LLM-as-a-judge, using a second model to score the first model’s output against a rubric, has become the practical way to scale evaluation beyond what human reviewers can cover. It doesn’t replace human judgment; it extends it. The pattern that works: use LLM-as-a-judge to score the bulk of production traffic automatically, then route a sampled subset, plus anything the judge flags as borderline, to human annotators for review. Datadog’s evaluation-driven workflow guidance describes exactly this: turning production traces into structured test datasets that feed back into your evaluation pipeline continuously, rather than treating evaluation as a one-time pre-launch checklist.
For CI/CD integration, follow this checklist:
- Add evaluator scoring as a required pre-deploy test, gating the build the same way a failing unit test would.
- Run regression tests specifically against your curated set of previously-failing traces, not just generic test prompts.
- Set a minimum quality score threshold that blocks merge if a prompt or model change drops below it.
- Re-run the full evaluation suite on a schedule against production traffic samples, independent of deploys, to catch drift that no code change triggered.
A minority of teams stop at offline testing and consider the job done. That’s the mistake. Non-deterministic systems keep changing underneath you, through provider updates, data drift, and usage pattern shifts, so the testing never truly finishes. Observability is what lets you catch that continuously instead of finding out from a customer complaint.
What Does AI Observability Look Like in Real Client Work?
Across engagements where we’ve helped teams stand up AI observability from scratch, the pattern repeats more often than you’d expect: the technology isn’t the hard part. Organizational friction is.
Most projects follow an audit, pilot, production rollout sequence. We start with an audit, not to sell more hours, but because you genuinely cannot design useful instrumentation until you know where the existing gaps are. Typical audit deliverables include an instrumentation plan mapping every layer we discussed earlier to a specific owner, an OTLP collector configuration ready to drop into an existing stack, a first pass at SLOs tied to the client’s actual business metrics, and an evaluation dashboard scoped to the top three failure modes we found in their traces. From there, a pilot on one feature or one agent workflow, then a production rollout once the pilot’s evaluators prove reliable against real traffic.
The organizational blockers show up in the same three places almost every time. Data access is the first: retrieval logs live with the data team, model calls live with ML engineering, and infrastructure metrics live with platform, and getting all three to agree on a shared trace schema takes longer than writing the instrumentation code itself. Retention policy is the second: legal and security teams need to sign off on prompt redaction before anyone captures a single production request, and that conversation goes faster when it starts on day one instead of after a security review flags it retroactively. CI/CD integration is the third: teams often have mature deployment pipelines that simply never had a quality gate built for non-deterministic outputs, and retrofitting that gate without breaking existing release cadence takes real coordination, not just a new YAML file.
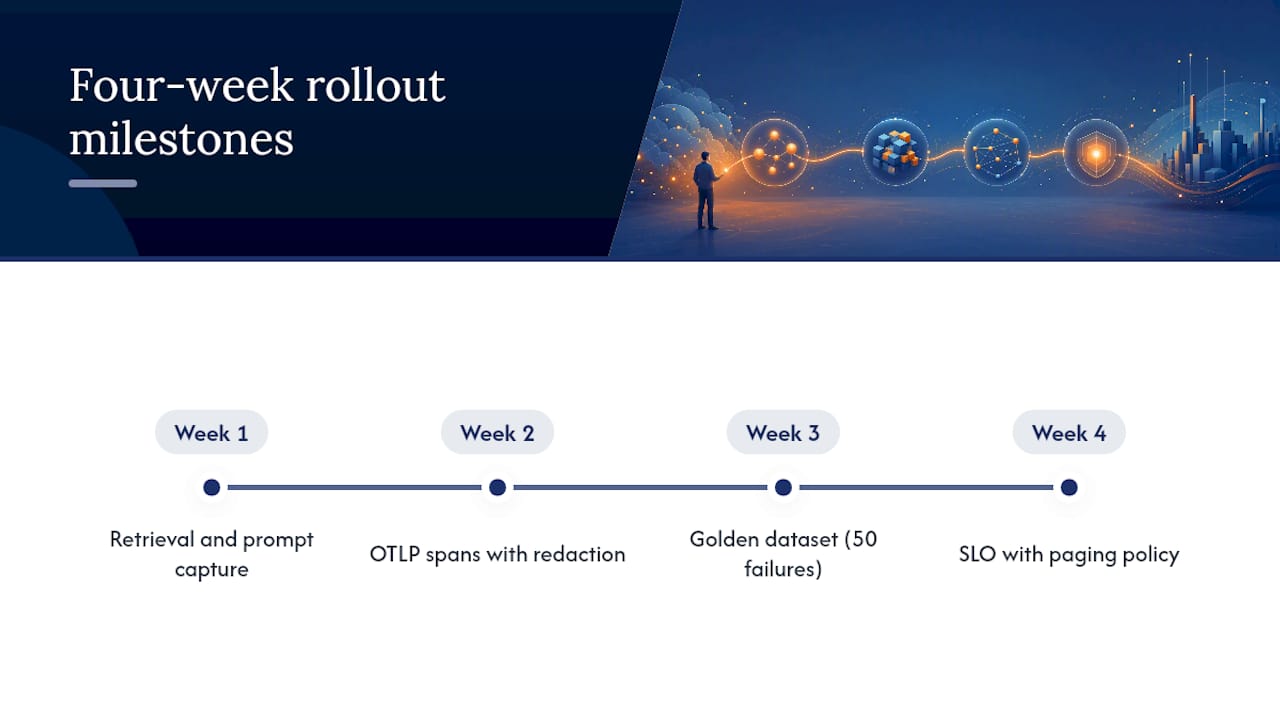
Reasonable milestones for a team doing this without a full outside engagement: week one, retrieval and prompt capture on your highest-traffic feature. Week two, OTLP spans flowing to a collector with redaction rules live. Week three, a golden dataset built from your worst 50 production failures. Week four, one SLO with a real paging policy attached. That’s a working system, not a finished one, but it’s enough to stop debugging by guesswork.
*— Chad
How Bowtie Helps You Build Production-Grade AI Observability
If you’ve read this far, you already know the gap between “we have some logging” and “we can actually trust our AI system in production” is wider than most teams budget for. That’s the exact gap Bowtie closes. We specialize in taking AI-generated and hand-built applications from prototype to production-ready, and observability instrumentation is where a lot of that work concentrates, because it’s the piece teams skip under deadline pressure and pay for later in incidents nobody can diagnose.
Our engagements typically start with a code audit, the same audit-first approach we described above, scoped specifically to your model integration and existing telemetry gaps. From there, deliverables scale with the project: an OTLP collector configuration built for your stack, an annotated golden dataset pulled from your own failing traces, evaluation rules tuned to your actual failure modes, and an SLO dashboard your team can page against from day one. We also handle the CI/CD integration work most teams underestimate, gating releases on quality metrics the same way you’d gate on unit tests, following engineering best practices built for modern software teams.
If your AI system is already live and you’re not confident you could root-cause a hallucination today, start with an AI code audit or request a project estimate for a full observability rollout. We’ll tell you honestly what’s missing before we build anything.
Frequently Asked Questions
What is the difference between AI observability and machine learning monitoring?
Machine learning monitoring traditionally tracks model performance metrics like accuracy drift and data distribution shifts for classic ML models. AI observability extends that to generative systems, adding prompt/response tracing, retrieval context, token and cost tracking, and LLM-as-a-judge evaluation, signals that don’t exist in a traditional classification model.
Do I need OpenTelemetry specifically, or can I use a proprietary SDK?
You can use a proprietary SDK, and it may get you running faster initially. OpenTelemetry’s advantage is portability: traces captured with GenAI semantic conventions work across backends, so you’re not locked into one observability vendor if your needs change or pricing shifts.
How much does trace volume typically cost at production scale?
Cost depends heavily on your traffic volume and how much raw prompt/response data you retain versus sample. Most teams manage cost by keeping full-fidelity data only for error and low-score traces, and aggregating the rest, rather than storing every request at full detail indefinitely.
Can predictive analytics tools replace dedicated AI observability platforms?
No. Predictive analytics tools forecast trends from historical data; AI observability tracks real-time correctness, grounding, and cost of a live generative system. They solve different problems and often sit side by side in a mature stack.
What’s the fastest way to improve AI observability on an existing system with no instrumentation?
Start with prompt, retrieval, and response capture on your single highest-traffic feature, add OTLP spans through an auto-instrumentation SDK, and build one evaluator scoring a sample of production traffic. That gets you real visibility in days, not a quarter, before you expand to full coverage.
Sources
- An Introduction to Observability for LLM-based applications using OpenTelemetry
- What Is AI Observability? | Datadog
- AI Agent Observability: Signals and Tools | MeshAI Labs